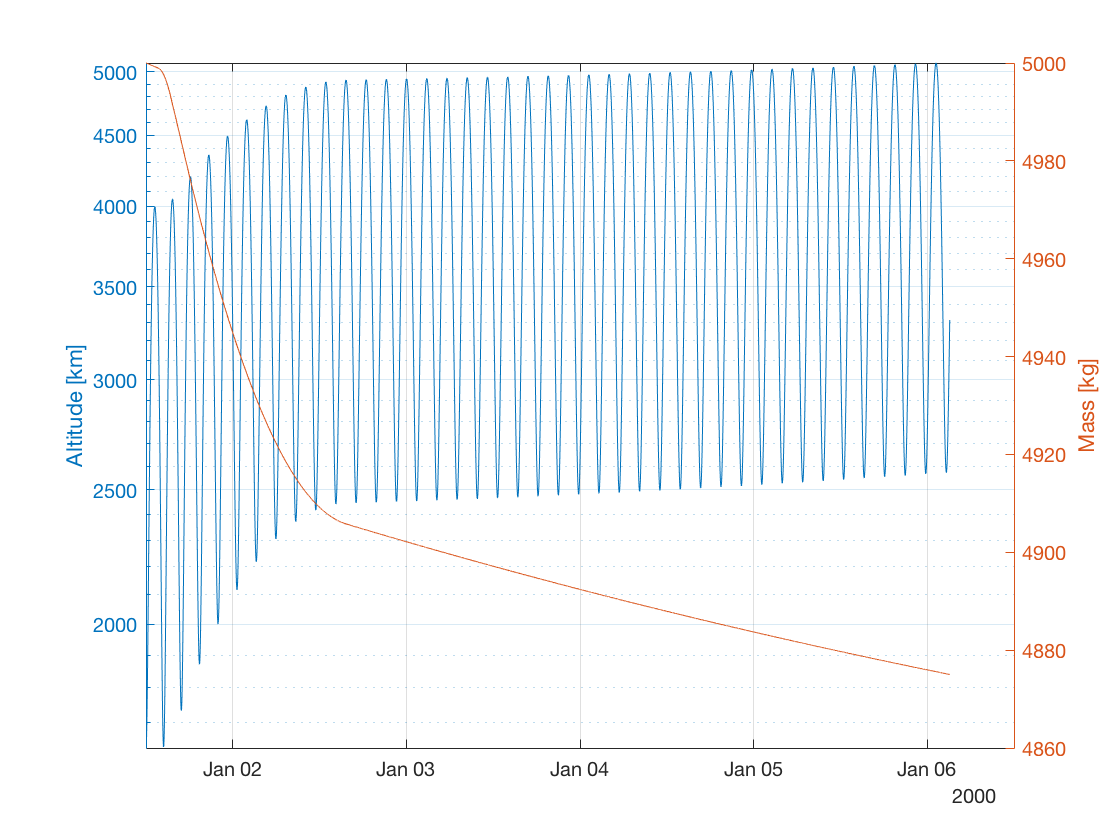
Thrust vector read from tabulated file
This tutorial describes how to propagate the orbit of a perturbed satellite about Earth which has a thrust force directed along the velocity vector using the MATLAB Interface, similar to the example Use of Thrust: User-defined Thrust Vector written in C++. The code for this example can be found at:
tudatBundle/matlabInterface/Examples/Seamless/thrustAccelerationFromFile.m
This example is identical to the one described in Thrust force along velocity vector, the only difference being that instead of creating the thrust force by defining its direction and (constant) magnitude, we provide the components of the thrust vector for several epochs using a tabulated file. This data is then interpolated and used to compute the thrust at each integration step. Thus, the set-up process is not repeated here. The only difference is the part of the code in which the Thrust object is created:
thrust = Thrust();
thrust.dataInterpolation.data = FromFileDataMap('thrustValues.txt');
thrust.dataInterpolation.interpolator.type = Interpolators.linear;
thrust.specificImpulse = 3000;
thrust.frame = ThrustFrames.lvlh;
thrust.centralBody = Earth;
accelerationsOnVehicle.vehicle = {thrust};
The file containing the thrust values looks like this:
tudatBundle/matlabInterface/Examples/Seamless/thrustValues.txt¶0 0 0 5
6068 0 1 5
6097 1.0 0 5
6097.5 0.8 0 5
6098 0.6 0.1 5
6099 0.1 0.5 5
12192 20 10 45
18288 30 15 40
1e5 0.4 2.0 3.0
3.999e5 1.0 1.0 2.0
4e5 1.1 5.0 1.0
The first column contains the epochs at which the thrust vector changes, while the the columns 2 to 4 contain the components of the thrust in the LVLH frame at each epoch.
After having defined all the setting needed for the propagation, we can write:
simulation.run();
Now we can plot the temporal evolution of the altitude and mass of the body. We compute the altitude using the function altitude of the package compute, which takes as arguments a matrix of Cartesian states (retrieved from columns 2 to 7 of the numerical solution) and the body from which to retrieve the average radius. The mass is retrieved from the eighth column of the numerical solution matrix:
dates = convert.epochToDate(simulation.results.numericalSolution(:,1));
h = compute.altitude(simulation.results.numericalSolution(:,2:7),Earth);
m = simulation.results.numericalSolution(:,8);

figure;
grid on;
hold on;

yyaxis left;
semilogy(dates,h/1e3);
ylabel('Altitude [km]');

yyaxis right;
plot(dates,m);
ylabel('Mass [kg]');
